Wealth Management Dashboard Spreadsheet | Georges Budget for Excel v16
Wealth Management Dashboard Spreadsheet | Georges Budget for Excel v16
Couldn't load pickup availability
- Extra 10% off with code SHOPSAVE10
- 10,000+ customers
- Spreadsheet Created by Owner
- One-Time Purchase: No Subscription
- Instant Download
- Fast Support: Based in USA
Simple wealth dashboard spreadsheet to manage your personal money and your wealth building goals. Awesome charts and reports to visually see where you are making your money and where you are spending your money. The Excel income and expense reports help you make decisions on if you need to make more money and where you are overspending and where to cut expenses to help offset rising prices due to inflation. Track your net worth growth in your bank accounts, investment accounts, home values and track your debt in your mortgage and credit card accounts.
New features in Georges Budget for Excel v16: (watch video  below for overview)
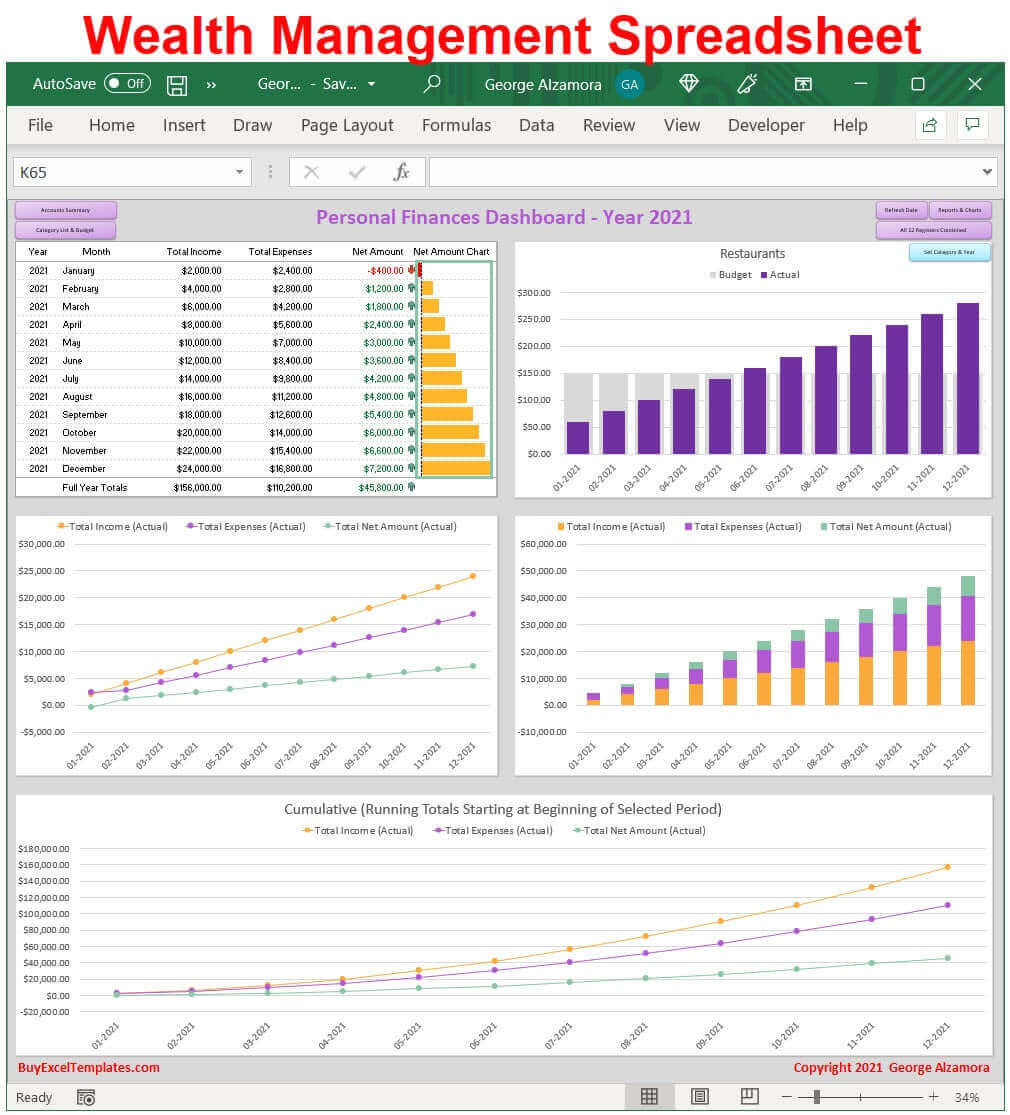
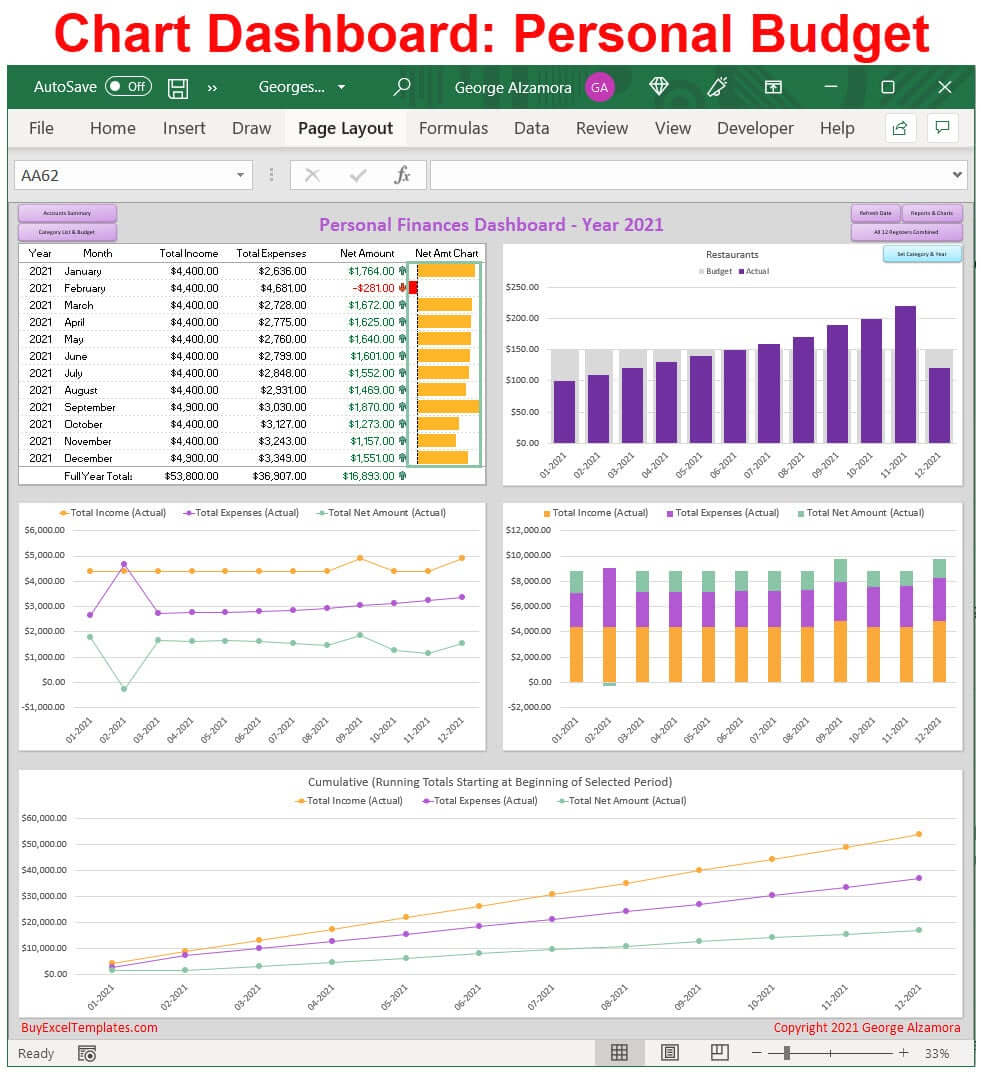
- New: In addition to the Accounts Summary, there is a new separate Chart Dashboard on a single worksheet with key information and charts automatically generated to help you manage your finances. The dashboard includes:
• Monthly Income vs Expense vs Net Amount Table
• Monthly Income vs Expense vs Net Amount Charts
• Cumulative Income vs Expense vs Net Amount Chart
• Single Category Actual vs Budget Monthly Chart
You can select the time periods of This Year, Last Year, & Last 12 months for the dashboard charts and table. The Table Report includes grand totals for the selected period and green / red up down icon arrows and green / red currency amounts to highlight positive or negative net amounts. The Monthly Income vs Expense vs Net Amount Charts include both an Excel line chart and an Excel stacked column chart that gives you multiple visual ways to look at your personal finances. The Cumulative Chart running totals start at the beginning of the selected time period and is an Excel line chart. The Single Category Actual vs Budgeted Monthly Chart is column chart.
- New: Each account register has an extra column titled Tag where you can add additional information related to your transactions such as tagging a transaction as tax deductible, personal vs business, fixed expense or variable expense, or needs vs wants. With the custom Pivot Table reports, you can then create your own income / expense reports based on the information you added in the new Tag register column such as a report that totals all tax deductible expenses for a given time period. Tags are a great way to group transactions and expenses so that you can run custom pivot table reports to help you better understand your cash inflows (income) and outflows (spending)
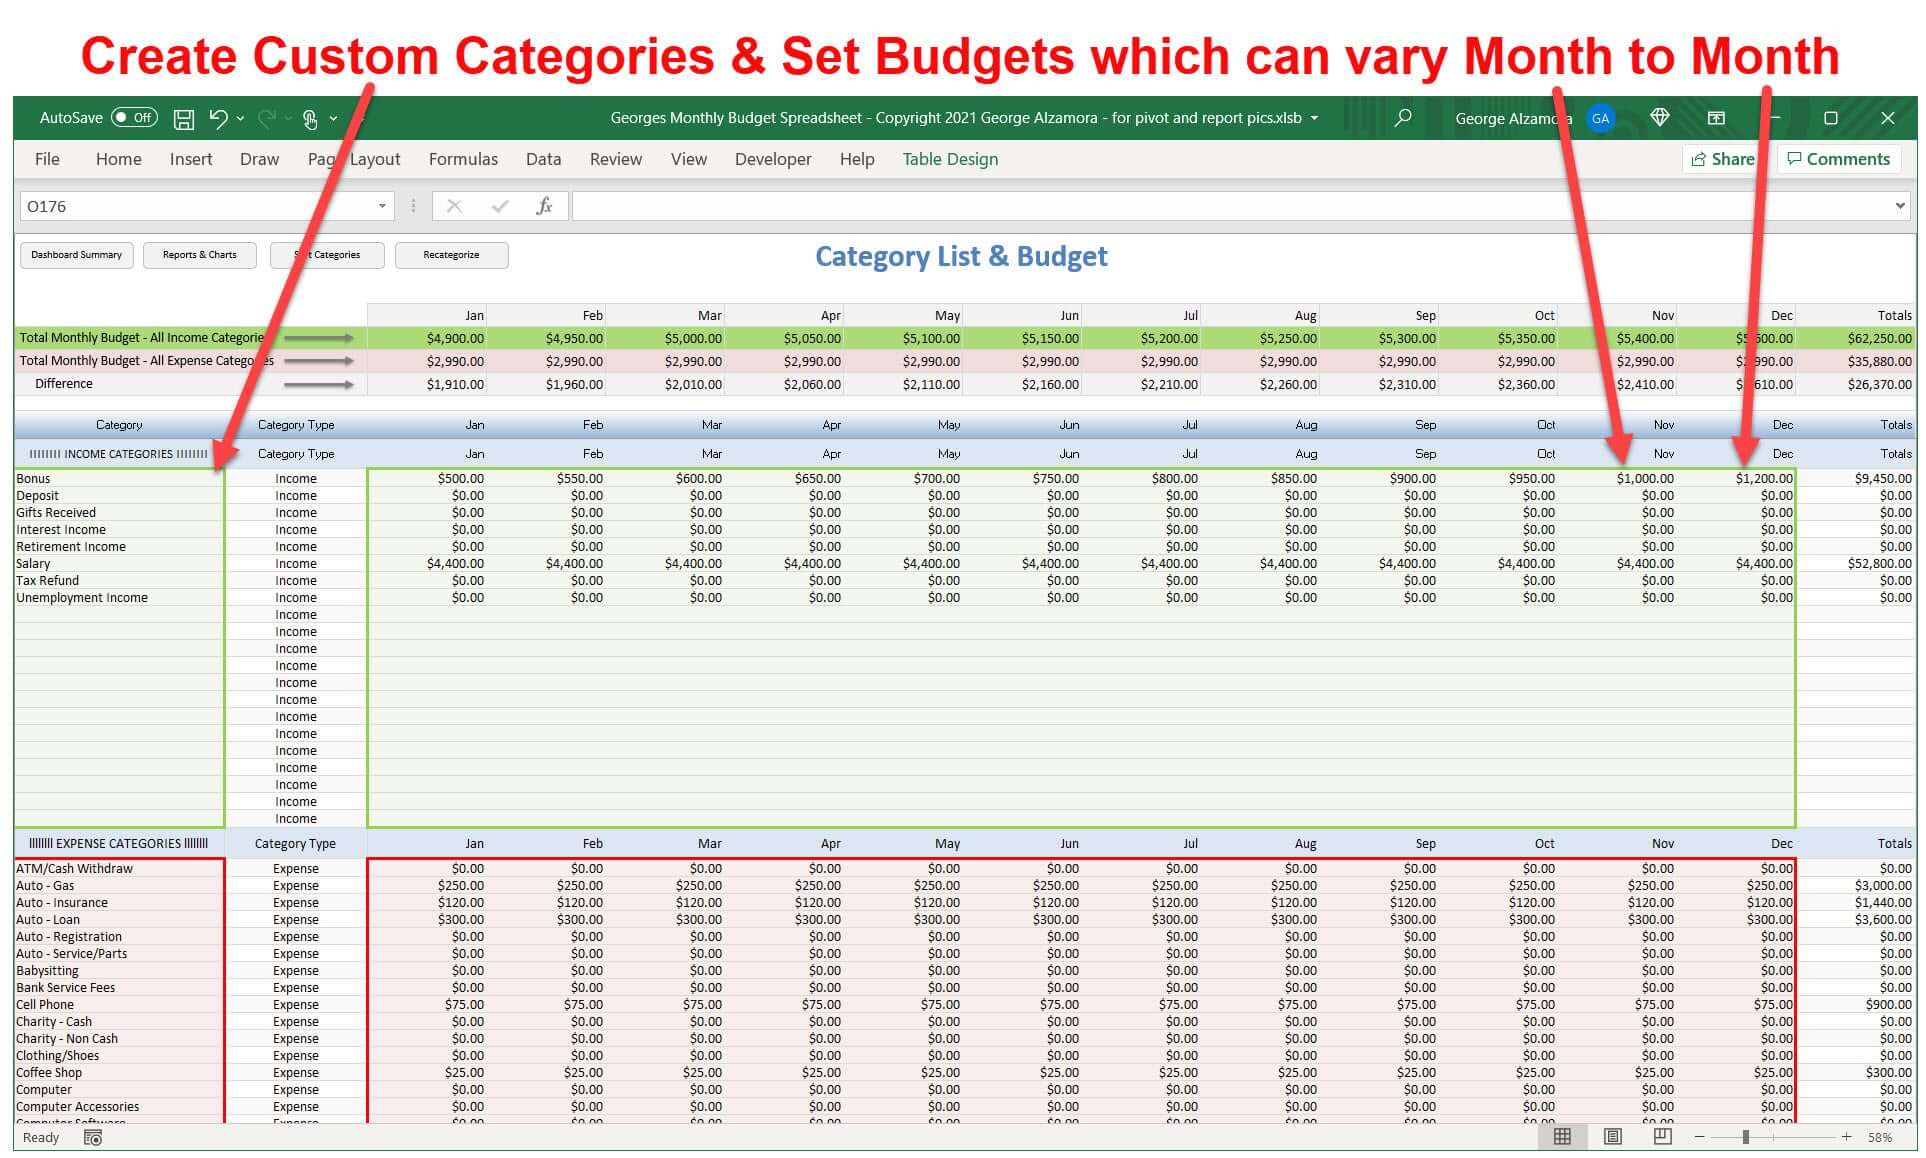
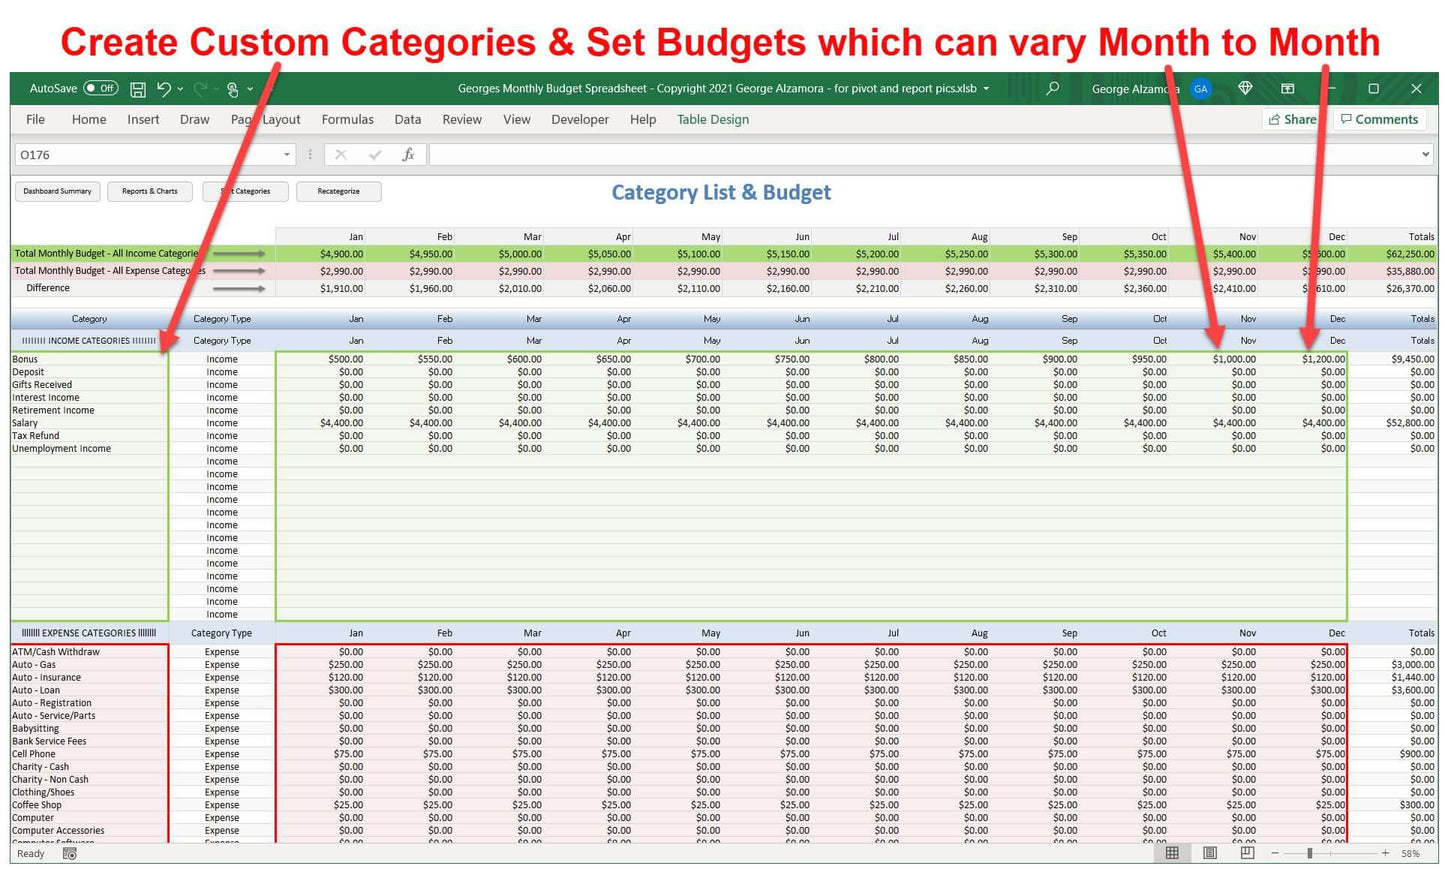
- New: When setting a budget for each category, you can now set a different budget for each of the 12 months of the year. For example, if you have an expense that is due quarterly on Jan, Apr, Jul, and Oct, you can now set a unique budget amount for just those 4 months and leave the other 8 months at $0. So instead of setting one monthly budget amount for a particular category, you can set 12 potentially unique monthly budget amounts for a particular category. In the prior versions, you could only set a single budget amount for a particular category and that budget amount applied to each month unless you changed it. Another example would be that you can now budget your electric bill to be a different budget amount for each month of the 12 months of the year to reflect months that you generally spend more or less on electricity. So for a particular category, you could then adjust these 12 potentially unique monthly budget amounts as needed during the year or for the next year.
Key tools in the software budget template
- As your financial situation changes, that budget template has great budget tools to help adjust with you by allowing you to create your own custom reports using the pivot table. While some reports are predesigned to quickly display results so that you can see key financial information quickly, the pivot tables also quickly generate reports but allow you to customized the layout and look of the reports to many different financial views. So you could tag spending as needs vs wants and then run and create custom report and Excel chart to compare how much you spent on necessities such as food and housing vs spending that you could live without such as traveling, entertainment or eating out.
- The wealth management dashboard spreadsheet includes 12 registers for you to enter your financial transactions from various bank accounts and other financial accounts such as checking accounts, credit card accounts, loan accounts, savings accounts, investments accounts, mortgage accounts, and retirement accounts. You can track both your asset accounts (cash accounts and other accounts that you own) and liability accounts (accounts where you owe money / debt accounts)
- The wealth manager spreadsheet allows you to create your own income budget categories and expense budget categories. The budget template allow you to add up to 50 budget categories and 200 expense categories and in the custom pivot tables you can run reports by categories to get category totals and also group categories to get group category totals. For example, you can create a groceries category, restaurant / dining category, and coffeehouses category and then group those 3 categories into one Food group and get both individual category totals and a total spend on Food from all 3 categories combined.
- In the Excel checkbook registers, Excel credit card account registers, and other account registers, you can filter transactions and get subtotals of the filtered transactions.
- In the checkbook register templates, you can reconcile your accounts so that you can keep your account in a balance. The registers automatically calculate, the register running balance using Excel formulas. The Excel checkbook registers automatically total the transactions outstanding and the transactions cleared and you can get a list of bank transactions that are cleared vs outstanding. These reconciliation tools help you keep your accounts in balance and save you time.
- In the Excel checkbook registers, you can date transactions with future dates to help you project and estimate what your account balances might be in the future based on anticipated cash inflows and cash outflows. This can give you some insight into your future financial health by estimating potential future cash flows and cash availability to pay upcoming bills. For example, if start entering the coming months income and expenses and you see that you will be short in the coming two weeks (negative checking account balance), then if possible, you might delay paying a bill early or cut back on certain expenses until the next paycheck. Also, the custom pivot table reports, such as the income vs spending reports, will also include future dated transactions if you choose to include then in the reports time period.
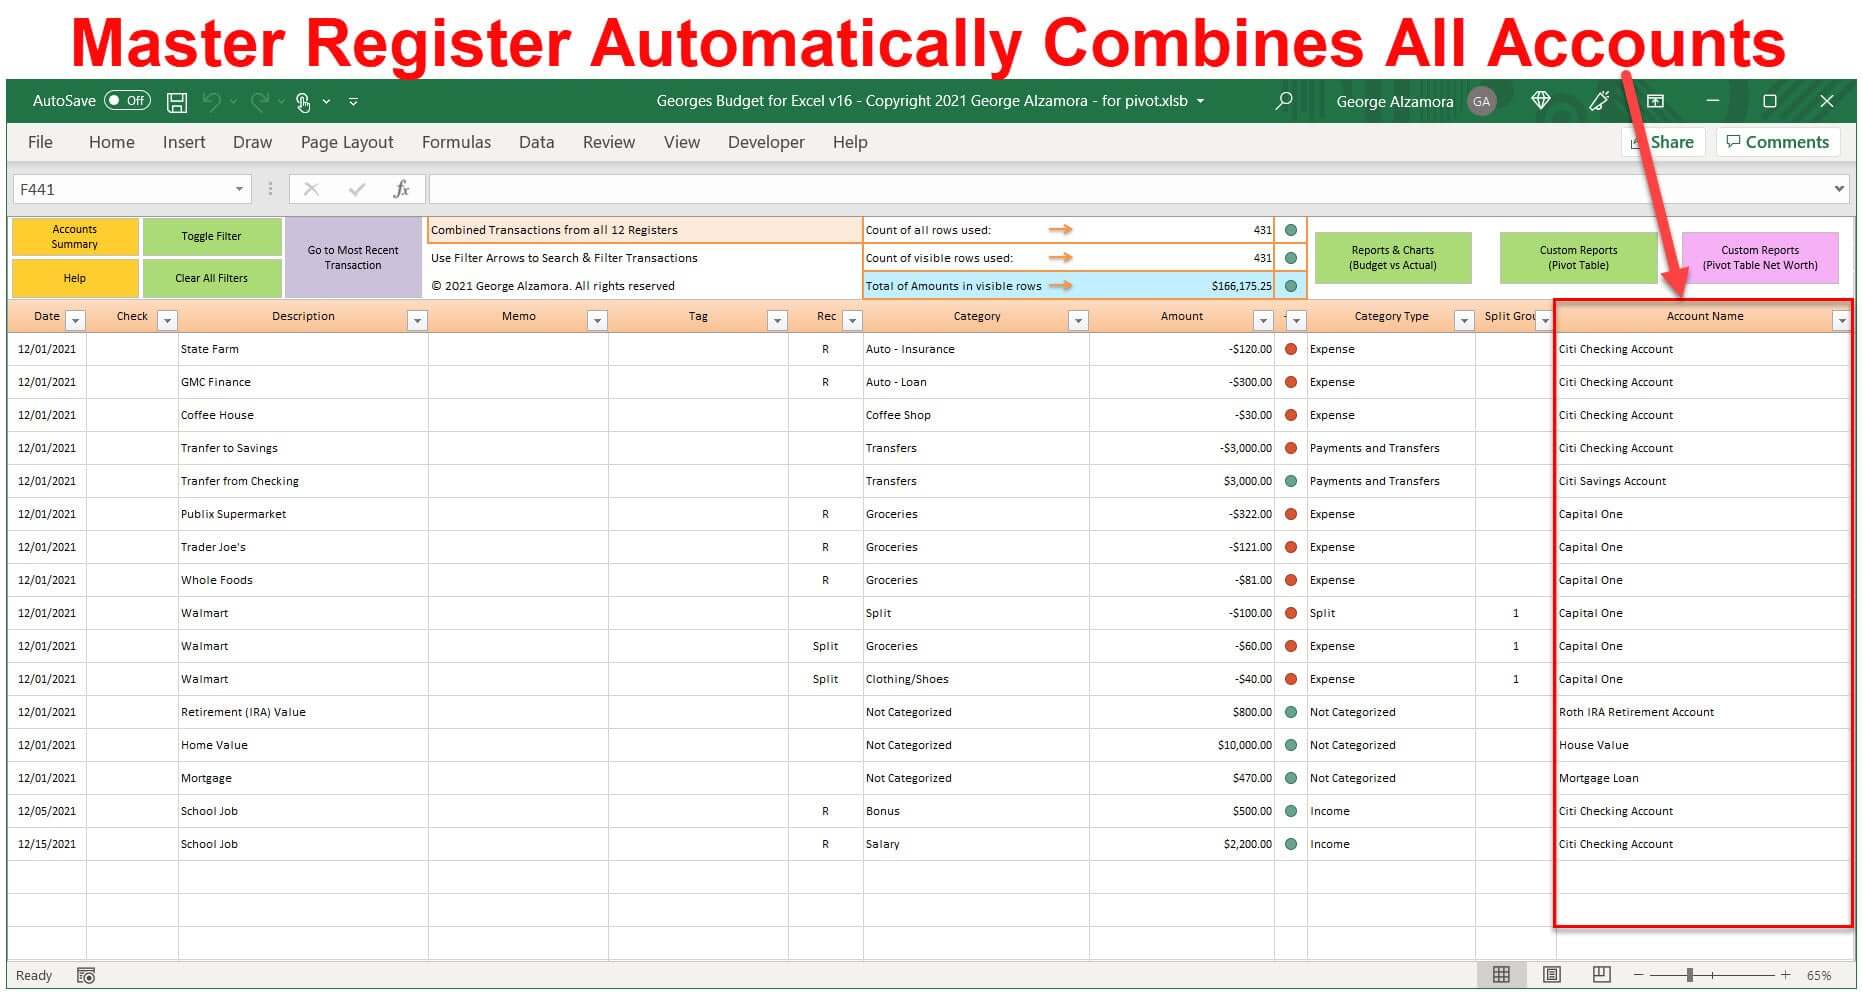
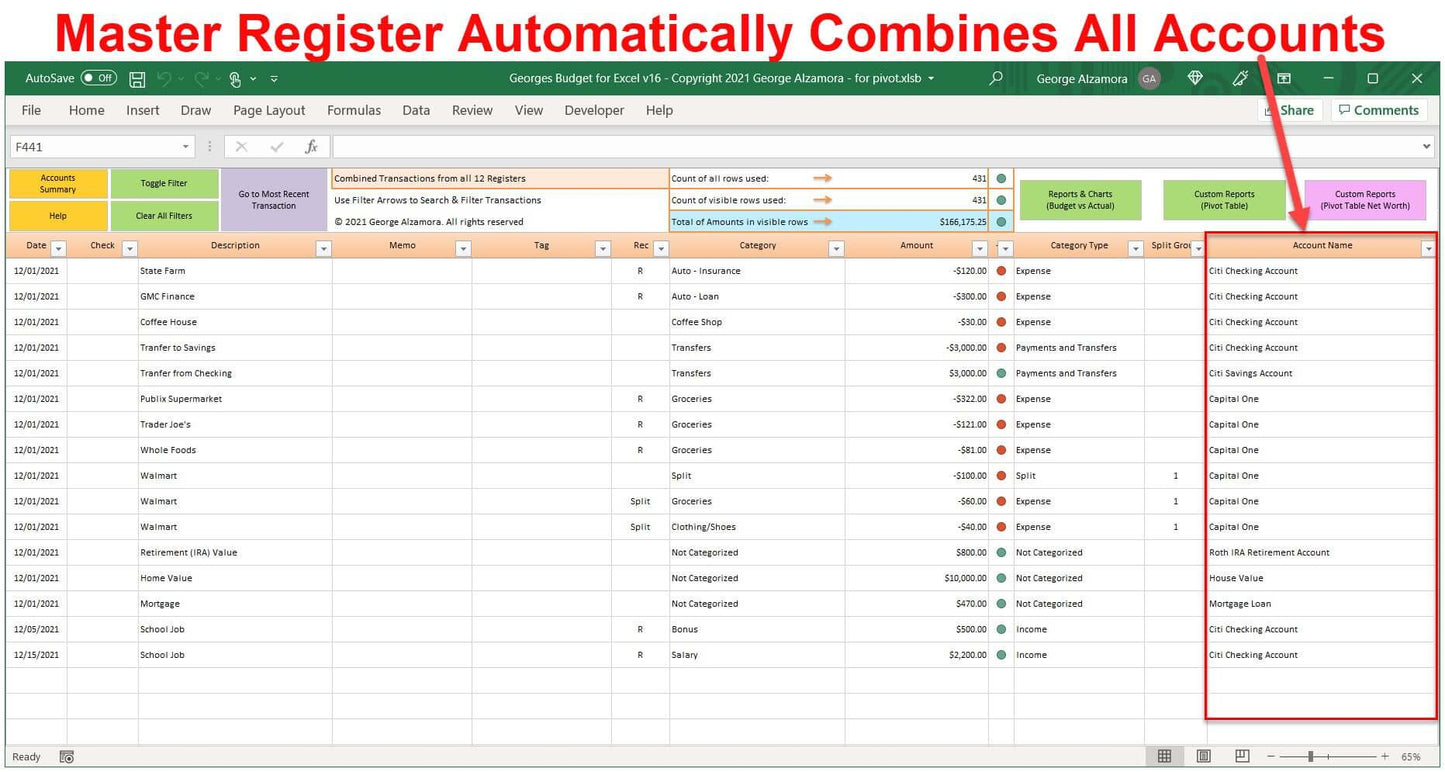
- The wealth building dashboard spreadsheet includes an automatically generated consolidated register that lists all of your transactions from all of the 12 account registers. This a great to filter on particular columns and get a list of transactions that meet that filter criteria and a subtotal of those transactions. For example, you can filter on the Category column for items marked with the Groceries category and get a list and subtotal of all transactions that meet that filter criteria no matter which account they are from. You could filter on multiple columns and all accounts, a group of accounts or just one account. The columns you can filter on are: Date, Check (for check number), Description (usually payees for expenses), Memo, Tag (new column with v16), Rec (to mark items are reconciled or split), Category, and Amount columns.
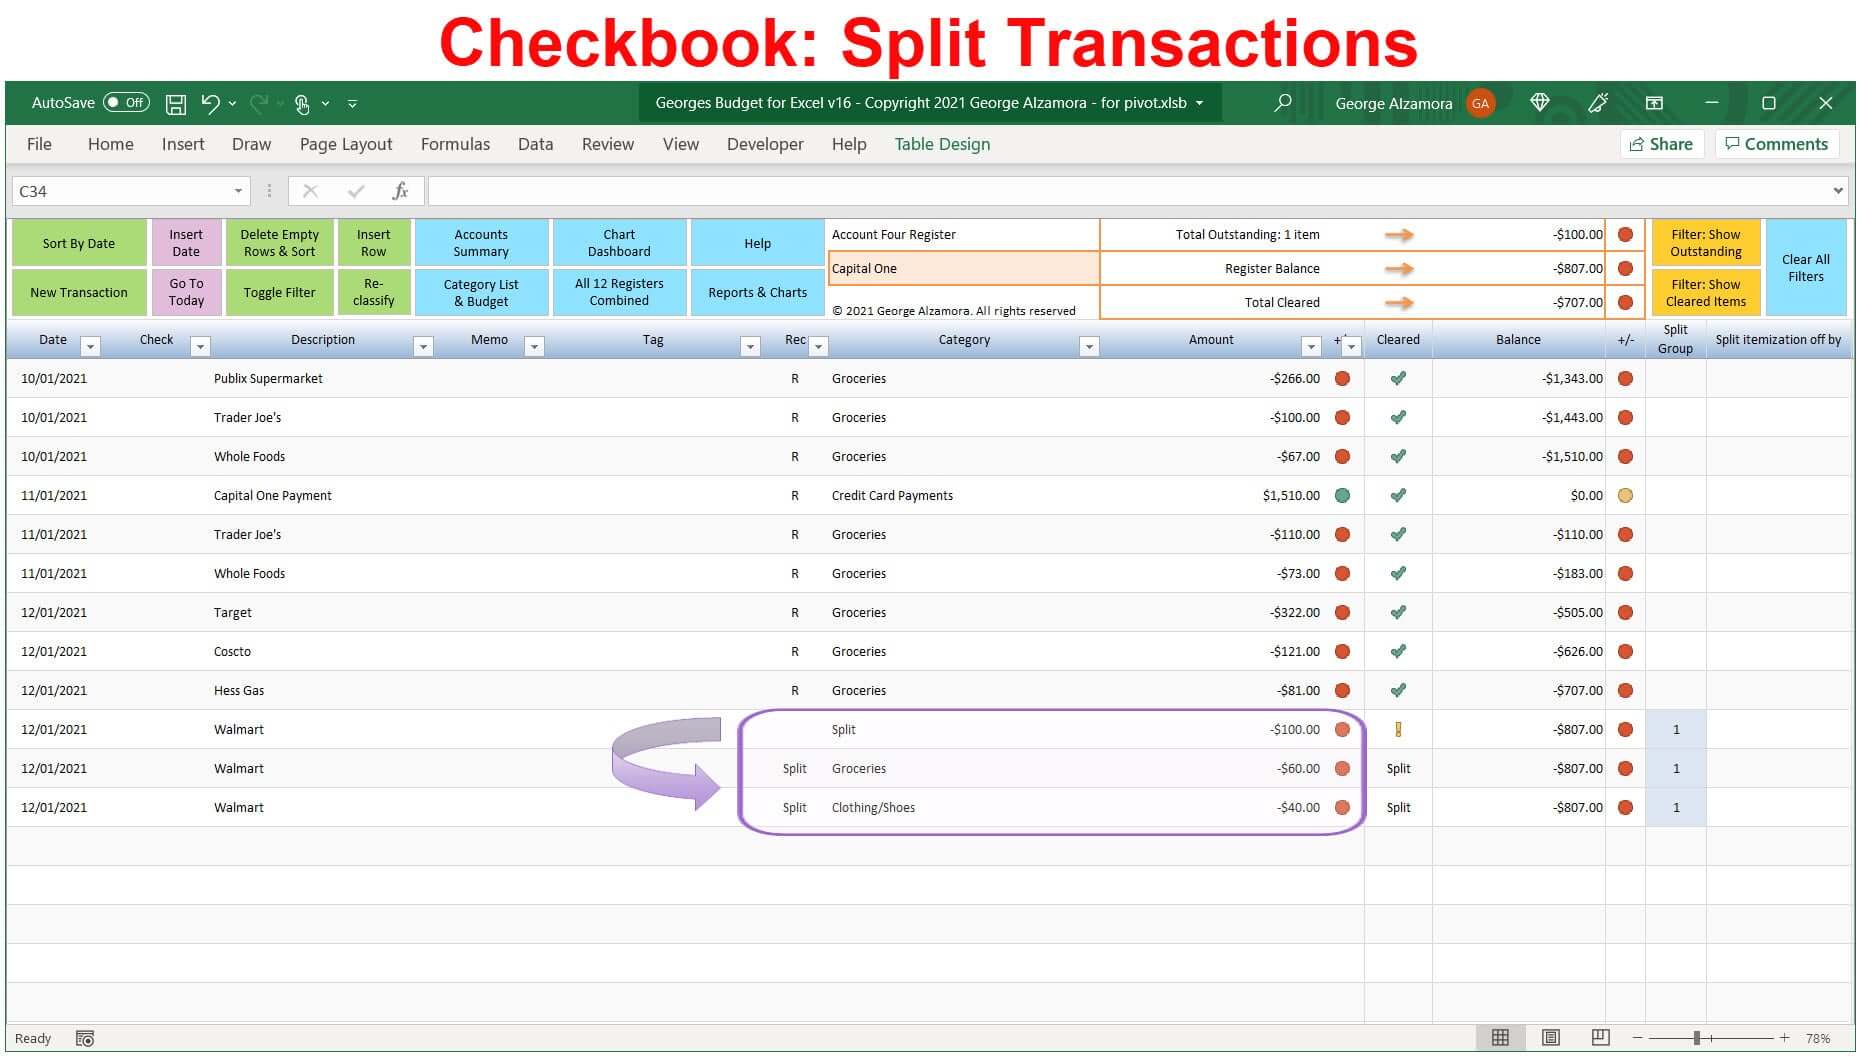
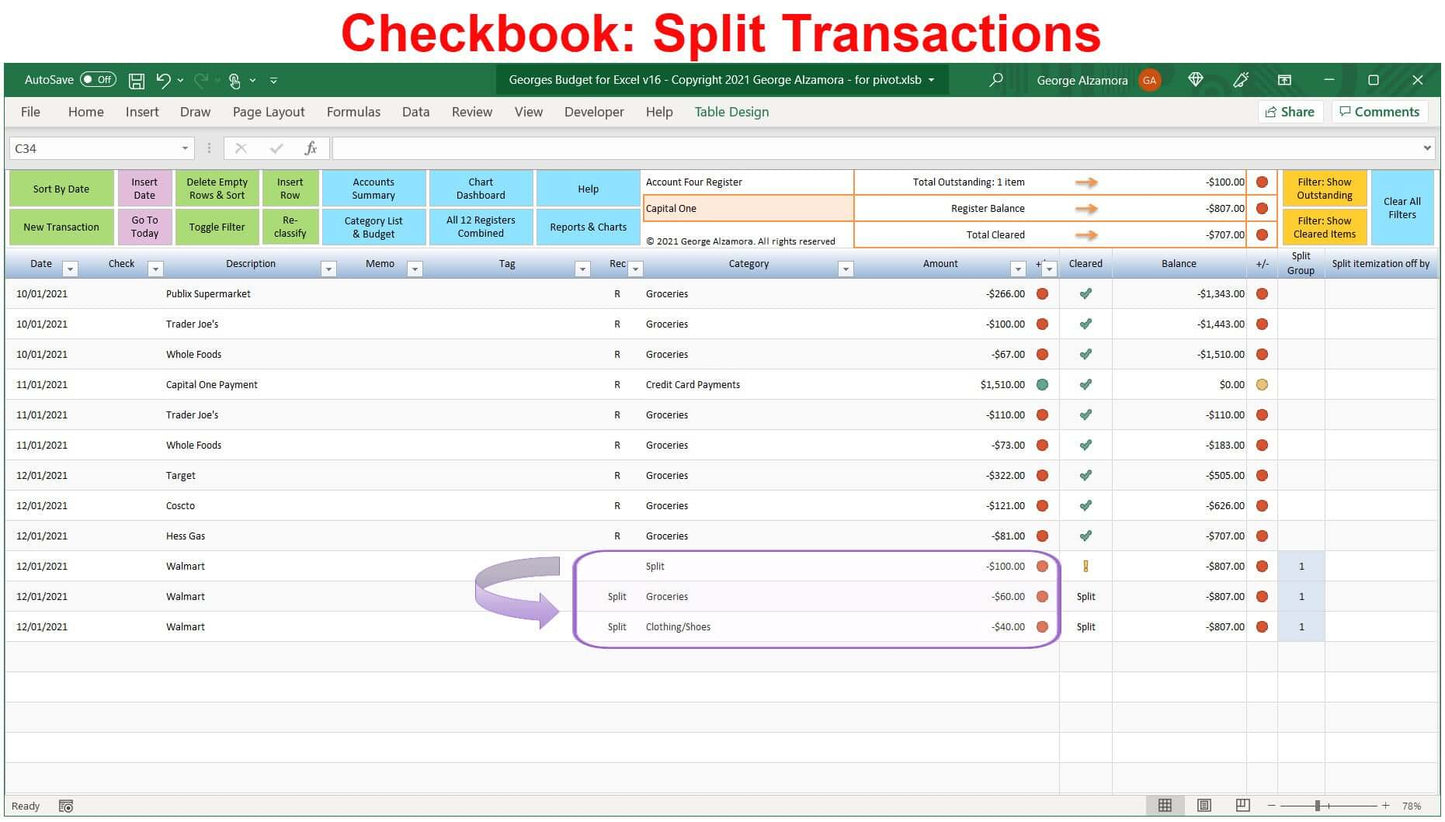
- In the wealth manager software, you can split transactions in the checkbook registers into more than one category. You can split transactions into multiple income categories or multiple expense categories. Splitting transactions into more than one category allows you to better reflect your actual spending. For example if you go to a large discount warehouse like Costco, Sam's club, BJ's and you purchase both groceries and clothing on one transaction, the checkbook software allows you to split the single transactions into two categories, groceries and clothing. You can split a single transaction into as many categories as there are rows available in the checkbook register.
- The Excel wealth manager spreadsheet has amazing reports to help you manage your finances. The budget software reports include both predesigned automatically generated Excel report templates and custom user designed Excel templates using Excel pivot table reports.
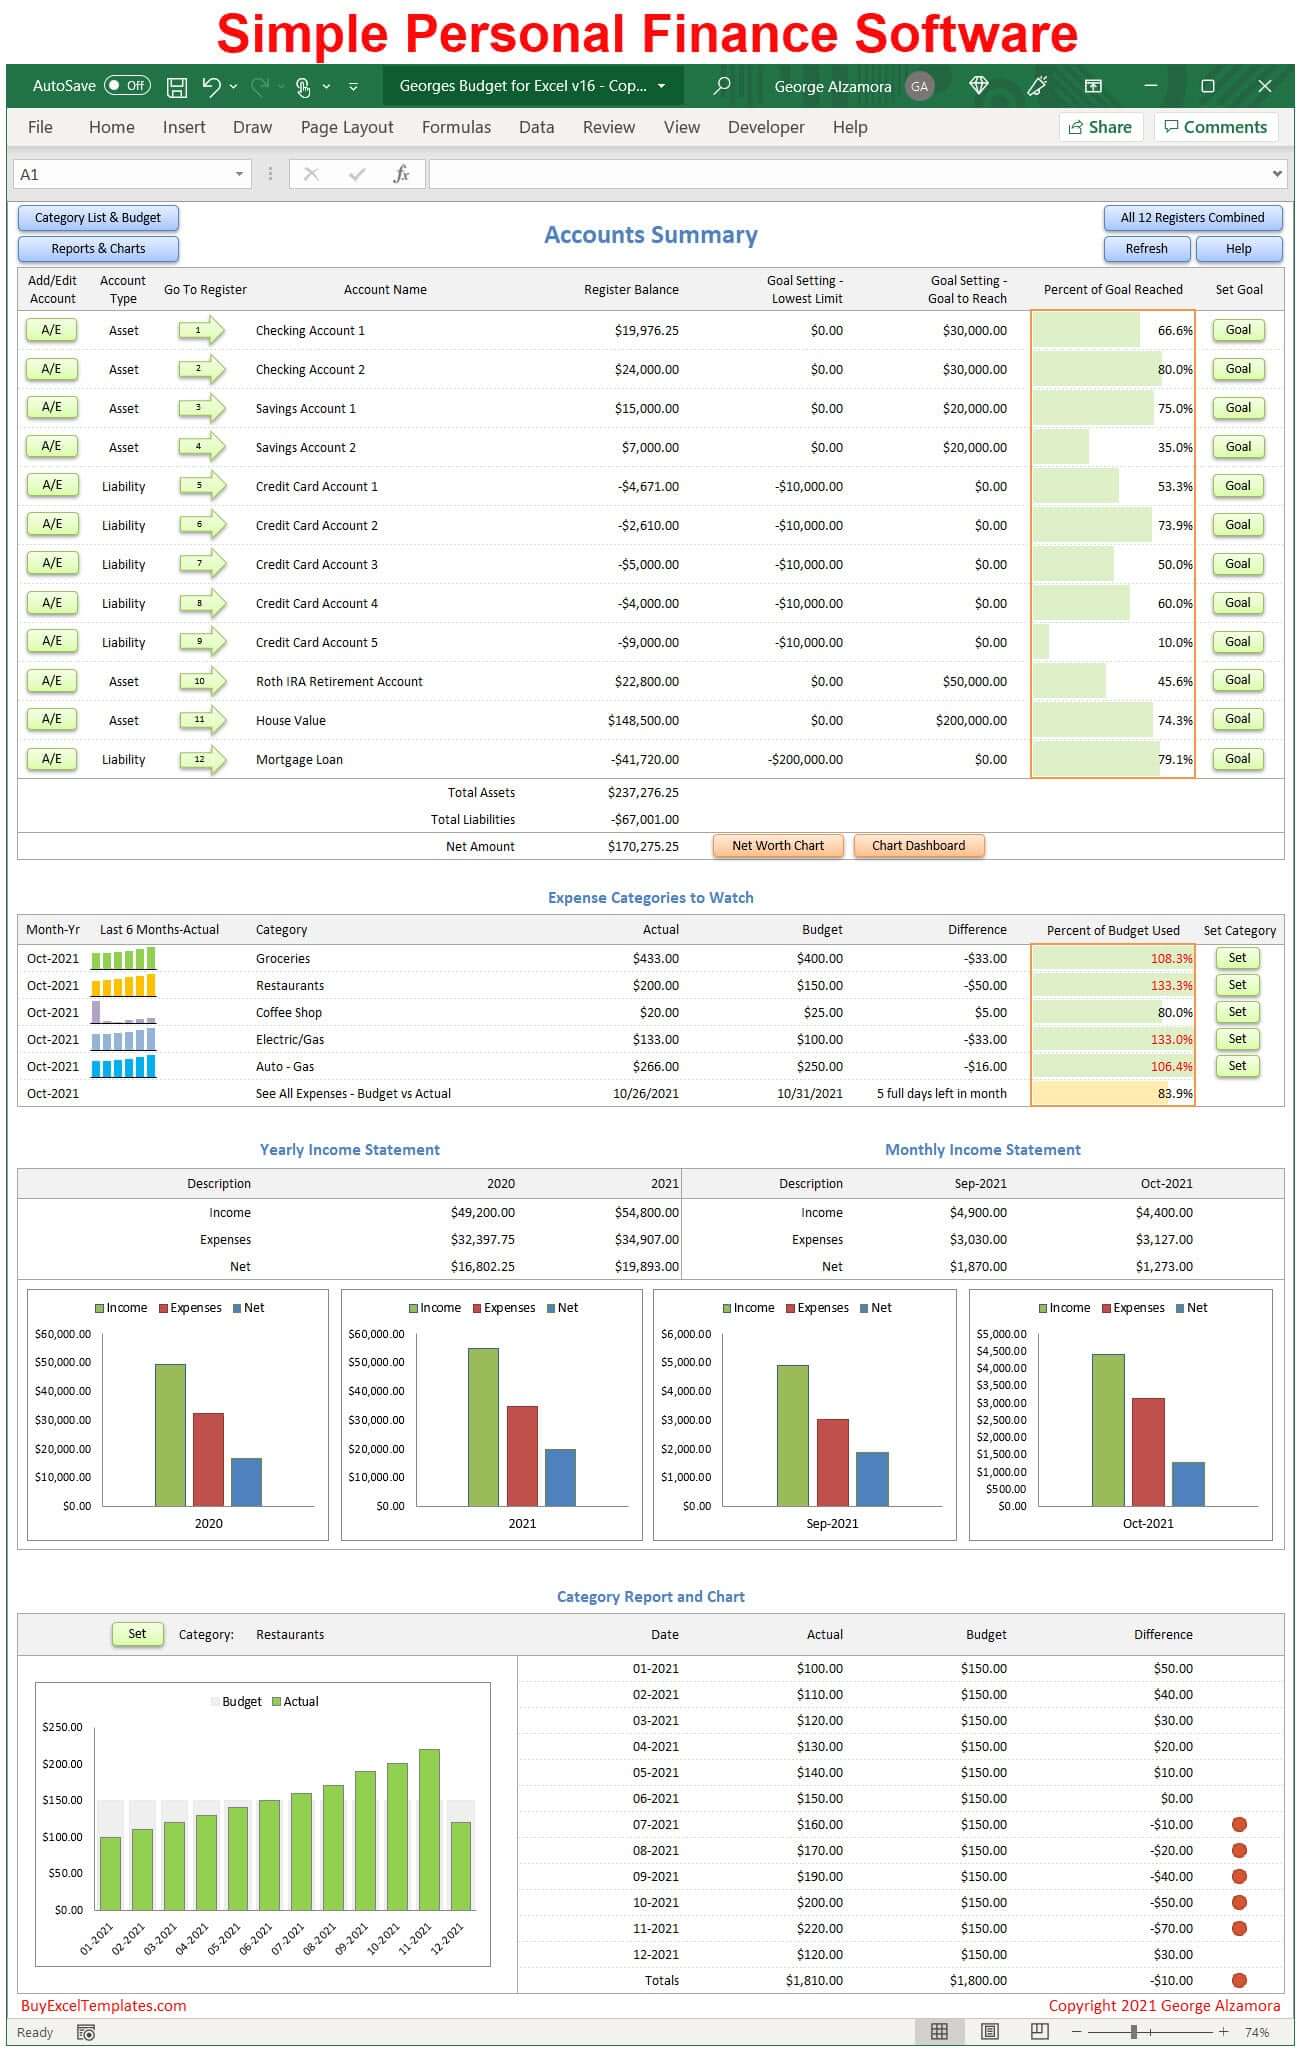
- The wealth manager software includes to main Excel dashboard reports. The Accounts Summary and the Chart Dashboard.
- The Accounts Summary lists all your accounts and their balances and provides Totals Assets, Total Liabilities and Total Net Worth. You can also set account balance savings goals to reach whether it be for a rainy day fund, large upcoming expense such as a wedding budget, or retirement savings goals. There are also key (top 5) expense categories to watch and compare to budget amounts set. There is total income vs expenses summary amounts. There is also a single category chart and report to focus in on particular budget category over a period of time to see trends in your spending.
- The Excel Chart Dashboard is a great place to see summary data and charts for month income and expenses including cumulative income and expense totals in Excel charts.
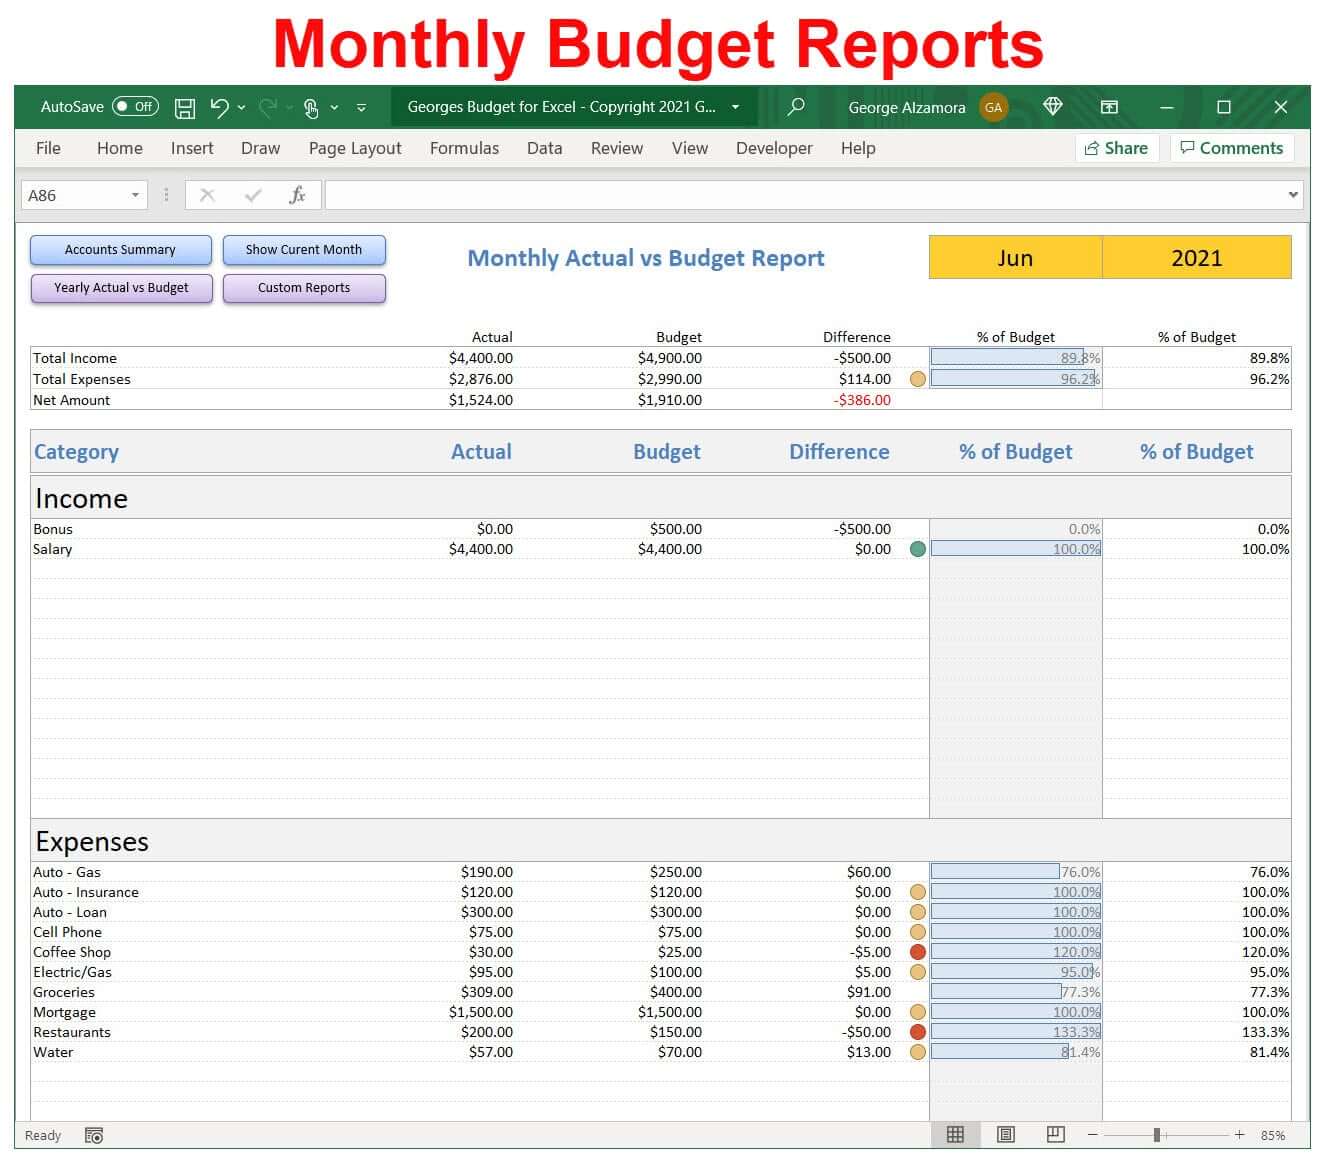
- There is a month budget vs actual report and yearly budget vs actual report for each category.
- The are two separate pivot table reports where you can customize the layout and look of the reports as those pivot table reports worksheets are not password protected. This give you more control on how to manage your money for your particular financial situation whether you are living paycheck to paycheck and focusing on managing limited resources and cash and staying within your monthly budget or whether you are a high net worth individual managing a diverse portfolio of multiple assets including hard assets such a real estate and gold and growing your wealth.
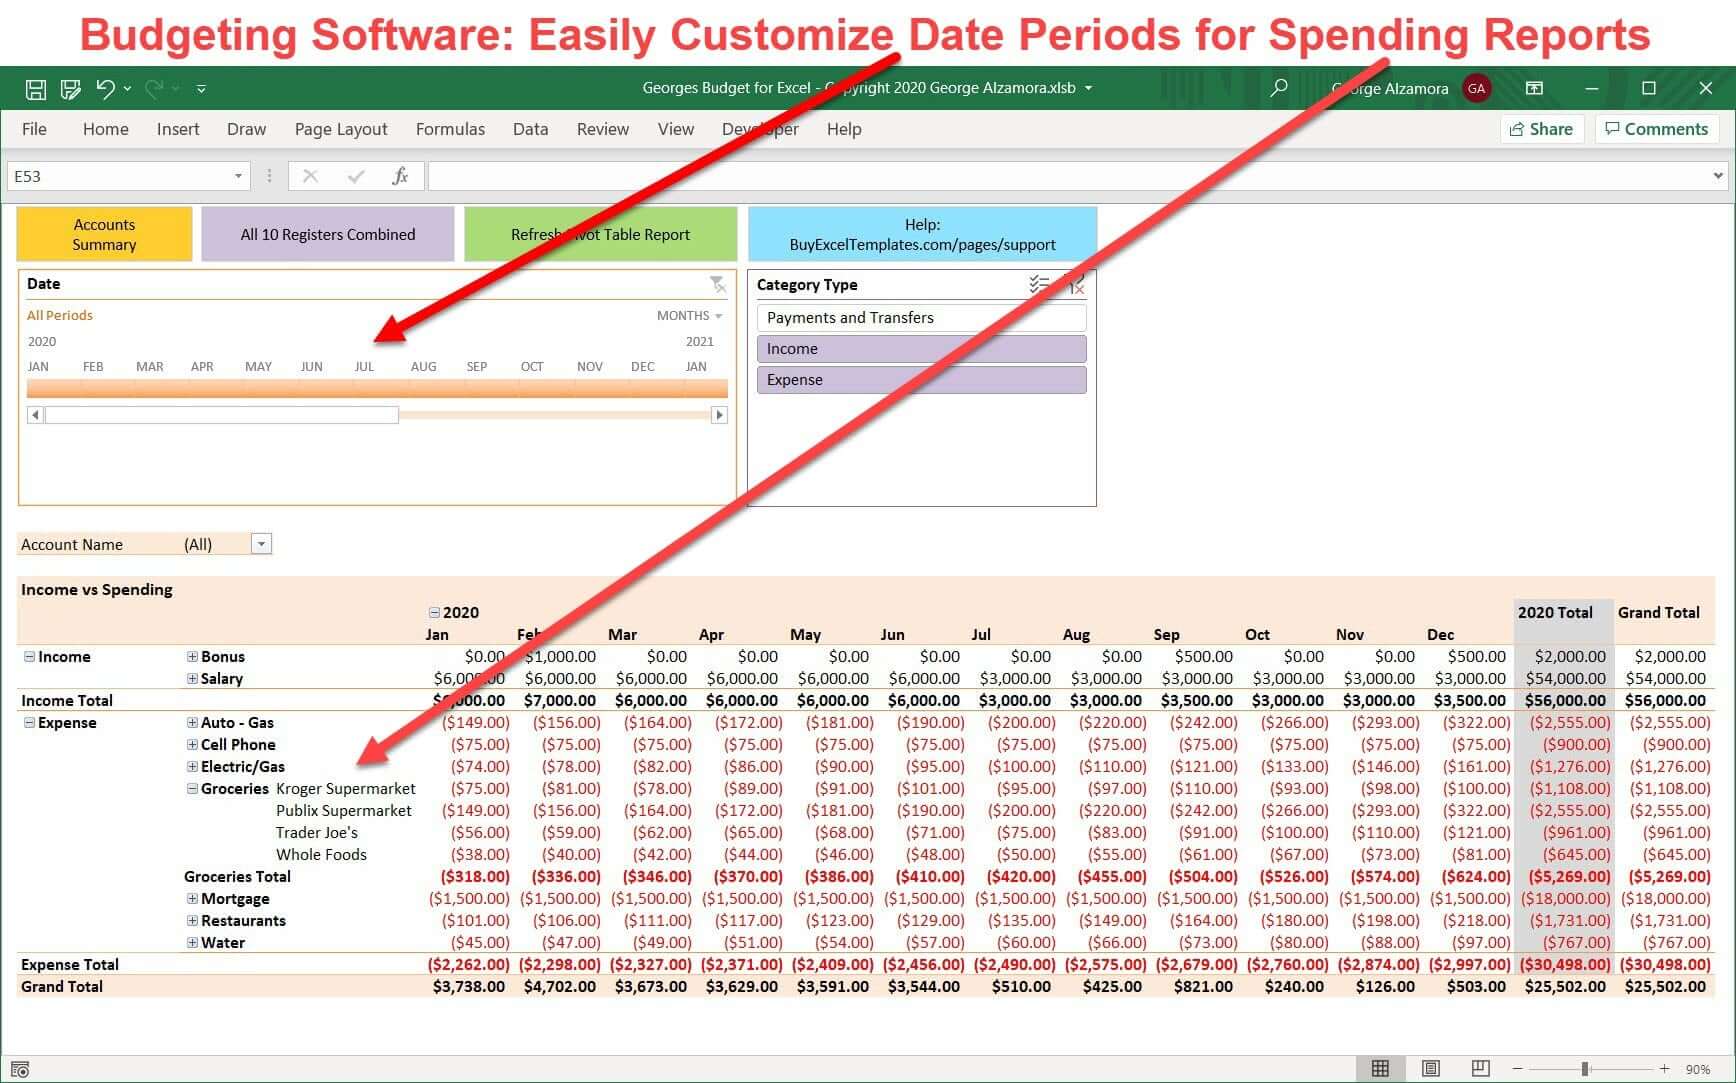
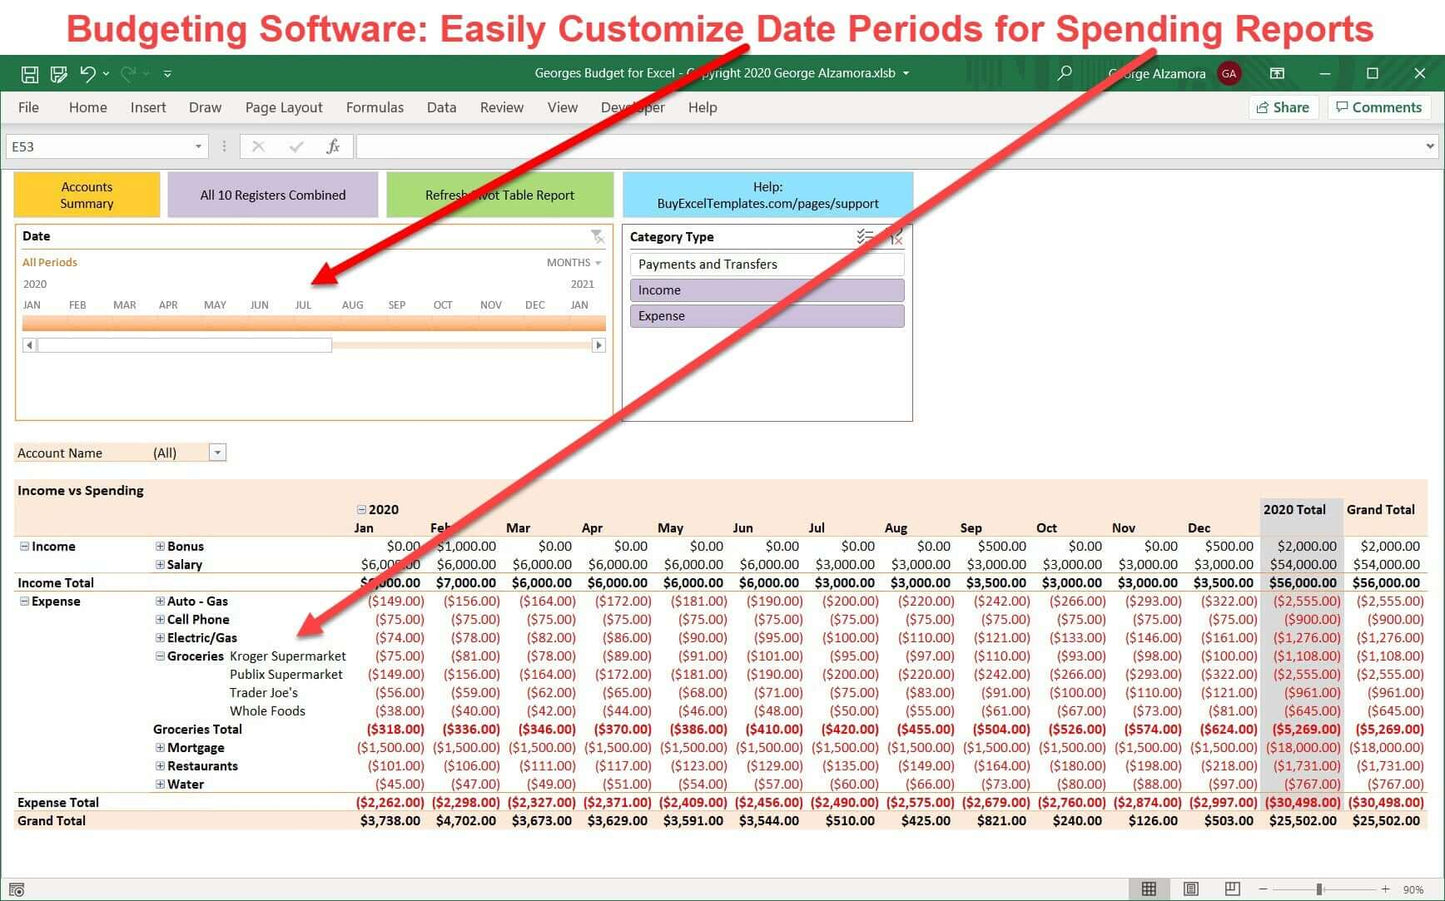
- In one of the custom pivot table reports, you can focus in on Income vs Expense (Income statement), Expense reports that focus not only on how much money was spent in a particular category but where the money is being spent such as at particular restaurants or entertainment venues, and Inflows vs Outflows reports for different times periods such at multi-year reports, yearly reports, quarterly reports, monthly reports, biweekly reports, weekly reports, daily reports, and even reports based a range of months or days. The Pivot Table Timeline allows you to easily visually select these periods of time on a timeline and you can also filter your pivot table report with pivot table slicers that are based on every column in the checkbook register templates.
- The second pivot table reports consolidates all your financial transactions into Assets and Liabilities so that you can see the growth of your money over time. With this personal balance sheet, you can track your account balances over time in both charts and table reports. This is import feature of the budget software that allows you to see the big financial picture of your wealth and how your net worth is trending whether that be the value your home, the balance of your home mortgage loan, the value of your retirement account investments or the balances in your credit card accounts, checking accounts and savings accounts over time allowing you to visualize the trends in your assets and debts and whether you are getting more into debt over time or paying down your debt over time and growing your cash and other assets over time.
Georges Budget for Excel v16 Summary
Some of the features that make this the best personal finance software:
- The budget templates allows for customization by the user in the Pivot Tables Reports and Charts
- The budget software is not just a budgeting tool to help you cut expenses and save money budget also a personal wealth tracker to track your wealth growth over time.
- The budget software includes beautiful Excel dashboard that help you see your overall financial picture and quickly see and understand what is going on with Excel charts and graphs.
- The budget spreadsheet is simple and quick to learn.
- The wealth management app is built on a popular platform: Excel Spreadsheet based budget app
- Price: One time purchase which does not require a subscription like many of the budget software programs
- The Excel wealth manager can be stored locally in the user prefers vs in the cloud.
- The Excel budget app does not require you to share or enter your financial banking password logins to sync your financial data as all the data is either manually entered into the Excel checkbook registers, Excel credit card registers, and other accounts or the information is manually downloaded from the banks or financial institutions and then bulk copied into the account registers to save time. Many users prefer this method for security reasons to prevent identify theft and for privacy reasons and there have been many incidences of customer information stored with companies that have been breached, hacked, and stolen.
- Georges Budget for Excel is the best selling budget software on BuyExcelTemplates.com and it is also a top rated money manager spreadsheet.
- Georges Budget for Excel is a well established budget software program created over 10 years ago with multiple new versions released over the years to add new improvements based in part on customer feedback to keep with up financial trends and give the users new tools to stay on top of their money and wealth. Please note that new versions must be purchased separately but there is no requirement to purchase a new version if one is released.
- Excellent and quick support is provided for Georges Budget for Excel in case you have any question both before purchase and post purchase.
System Requirements:
- PC (Microsoft Windows computer) with one of the following versions of Excel
- Microsoft Excel 2021 / Excel 2024 (one-time purchase, non-subscription)
- Excel for Microsoft 365 (previously named Excel for Office 365). (part of Microsoft 365 subscription / Office 365 subscription)
- Mac Computer with one of the following versions of Microsoft Excel for Mac.: (Not compatible with Apple iPhone or Apple iPad)
- Microsoft Excel 2021 for Mac / Excel 2024 for Mac (one-time purchase, non-subscription)
- Excel for Microsoft 365 for Mac (Excel for Office 365 for Mac) (part of Microsoft 365 subscription / Office 365 subscription).
- PC and Mac Computers should have minimum 4 GHz processor, 8 GB RAM and SSD storage. The home budgeting spreadsheet (Georges Budget for Excel v16) may work if the Windows computer or Mac computer has less than these system requirements but it will be slower due to large amount of Excel formulas and the Excel template may not work.
- The money management software is supported in the United States, Canada, and Australia as amounts are formatted with the $ symbol and Dates are formatted as MM/DD/YYYY.
- If you are using a Windows computer, you need the Windows 10 or Windows 11 (64 bit versions) and Excel for Microsoft 365 or Excel 2021 (64 bit versions) as apposed to the 32 bit versions. If you are using a Mac computer, you need Mac OS (64 bit version) and Excel for Microsoft 365 for Mac or Excel 2021 for Mac (64 bit version) as apposed to the 32 bit versions.
- The Excel template is not compatible with Google Sheets (Google Spreadsheets)
- The Excel budget template is not compatible with Apple Numbers spreadsheets
- The home budgeting spreadsheet is not compatible with Microsoft's free "Excel Online" app that is part of the free Office Online apps. These online apps are web browser based and have limited features compared to the full desktop version of Microsoft Excel.
- The Excel budget template is not compatible with the Excel Mobile app whether using Android or iPhone. (Excel mobile app is part of Microsoft Office Mobile apps that allow you to use a feature reduced version of Excel on your compatible mobile phone and smaller tablet devices to review, update, and create spreadsheets). The Excel template requires one of the full desktop versions of Excel listed above in the system requirements.
- Your desktop or laptop computers operating system (PC with Windows 11, Windows 10 or Windows 8 or a Mac computer with the latest Apple macOS operating systems) needs to be compatible with one of the listed compatible versions of Microsoft Excel and the hardware specs.
- Excel 2021 and Excel 2021 for Mac are Microsoft software products that you only have to pay for once so that is a great alternative for those who do not want to pay for the Microsoft 365 monthly subscription service or yearly subscription service. This is because Excel 2021 and Excel 2021 for Mac have a perpetual license that you pay for once and that allows you to use the software for as long as you own it and have compatible software to run it.
License Terms and Refund Policy:
By purchasing you agree with the License Terms / Terms of Sale.
By purchasing you agree with the refund policy.
Excel is a registered trademark of Microsoft Corporation.
Video: Wealth Management Dashboard Spreadsheet
I have used excel budget v10 and v14 respectively. V16 is a nice upgrade to v15 but kindly make it a multicurrency template to enable us use the various currencies of the world in our budgets.
I have been a fan of George and Budget for Excel since v12. V12 was itself a great product, and with each version it keeps getting better and better. Many enhancements and tweaks have come along which makes Budget for Excel just perfect for my needs. Another very nice aspect is that George is very open to suggestions and "would be nice". Everything I have communicated to George has found its way into the next version. I like that. I like George. I like his product. Do yourself a favor and get Budget for Excel. You won't be disappointed!

